


News Center
News Center
Current Situation of Nonwovens Market in Russia
Release time:
2022-02-18
As we all know, to judge the market size of a product in a country, we should know the production, import and export volume of this product in that country. The difficulty of assessing the size of the Russian nonwovens market is that the production of non-woven fabrics in the official statistics of Russia is in square meters, while the import and export volume are in thousands of tons.
As we all know, to judge the market size of a product in a country, we should know the production, import and export volume of this product in that country. The difficulty of assessing the size of the Russian nonwovens market is that the production of non-woven fabrics in the official statistics of Russia is in square meters, while the import and export volume are in thousands of tons.
According to the Russian State Statistics Office, the production of nonwovens (excluding felt) in Russia reached 6.027 billion square meters in 2021, an increase of 10.5 percent compared to 5.453 billion square meters in 2020 (Figure 1). If you refer to other statistics, the production of Russian nonwovens and their finished products (except clothing) in 2021 will be 7.44 billion square meters. Among them, 82% of nonwovens are produced in the central region (the central region centered on Moscow),14% are produced in the Volga region, the northwest region and the Ural region account for 1.9 and 1.1 respectively, and the proportion of other regions does not exceed 1%.
According to the report of the Federal Customs Service, the import volume of Russian nonwovens in January-November 2021 was 97900 tons, an increase of 9.7 percent year-on-year (Figure 2). The largest sources of Russian nonwovens imports are China and Belarus, which account for 39.4 per cent and 21.8 per cent of total Russian nonwovens imports, respectively (Table 1).
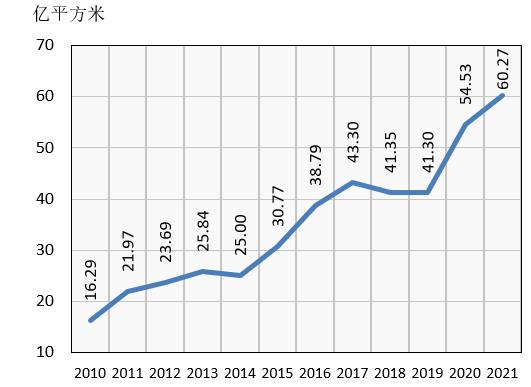
Figure 1 Production of nonwovens (without felt) in Russia from 2010 to 2021
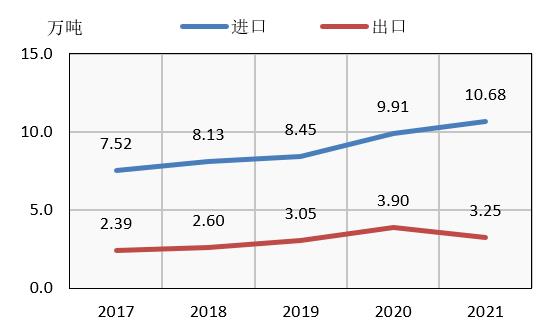
Figure 2 Russia's imports and exports of nonwovens, 2017-2021
Note: Imports and exports in 2021 in this figure and in Figures 3 and 4 are projections based on data for the first 11 months of 2021.
Table 1 Russian imports of nonwoven fabrics from January to November 2021
|
Country of origin |
Imports (tons)and proportion |
|
China |
3.86 (39.4%) |
|
Belarus |
2.14 (21.8%) |
|
Germany |
0.51 (5.2%) |
|
Czech |
0.49 (5.0%) |
|
Israel |
0.40 (4.0%) |
|
Turkey |
0.37 (3.8%) |
|
Italy |
0.32 (3.3%) |
|
Poland |
0.26 (2.6%) |
|
Denmark |
0.16 (1.7%) |
|
SROVEIA |
0.16 (1.7%) |
|
United States |
0.14 (1.4%) |
|
Uzbekistan |
0.10 (1.0%) |
|
Other |
0.88 (9.0%) |
|
Total |
9.79 (100.0%) |
In the first 11 months of 2021, the export volume of Russian nonwovens was 29800 tons, down 17.5 percent year-on-year. Kazakhstan, Belarus and Ukraine are the main export countries, accounting for 25.9 per cent, 18.1 per cent and 13 per cent of Russia's total non-woven exports, respectively (table 2).
To understand the situation of the nonwovens market, it is also necessary to pay attention to the following indicators: the production, import and export volume of synthetic fibers and man-made fibers used to produce nonwovens. From January to November 2021, Russian synthetic fiber imports reached 160400 tons, an increase of 27.8 percent year-on-year. The largest sources of imports are Belarus, China, South Korea and Uzbekistan (Table 3).
Table 3 Russia's synthetic fiber imports in January-November 2021
|
Country of originand regions |
Imports (tons)and proportion |
|
Belarus |
4.13 (25.8%) |
|
China |
3.05 (19.0%) |
|
Korea |
2.216 (13.8%) |
|
Uzbekistan |
2.18 (13.6%) |
|
India |
0.80 (5.0%) |
|
Turkey |
0.56 (3.5%) |
|
Vietnam |
0.48 (3.0%) |
|
Other |
2.62 (16.3%) |
|
Totalmeter |
16.04 (100%) |
In January-November 2021, the export volume of Russian synthetic fibers was 8800 tons, an increase of 52.1 percent year-on-year. The main purchasing countries of synthetic fibers in Russia are Belarus (which accounts for more than half of the total synthetic fiber exports from Russia) and Kazakhstan (which accounts for nearly a quarter of the total synthetic fiber exports from Russia) (Table 4). At present, the production statistics of synthetic fibers in Russia in 2021 have not been released, and the data for 2017-2020 are shown in Figure 3.
Table 4 Export volume of synthetic fiber from Russia, January-November 2021
|
Destination country |
Export volume (tons)and proportion |
|
Belarus |
0.475 (54.2%) |
|
Kazakhstan |
0.205 (23.4%) |
|
Lithuania |
0.082 (9.4%) |
|
Kyrgyzstan |
0.047 (5.4%) |
|
Ukraine |
0.017 (1.9%) |
|
Czech |
0.013 (1.5%) |
|
Armenia |
0.011 (1.3%) |
|
Other |
0.026 (2.9%) |
|
Total |
0.88 (100%) |
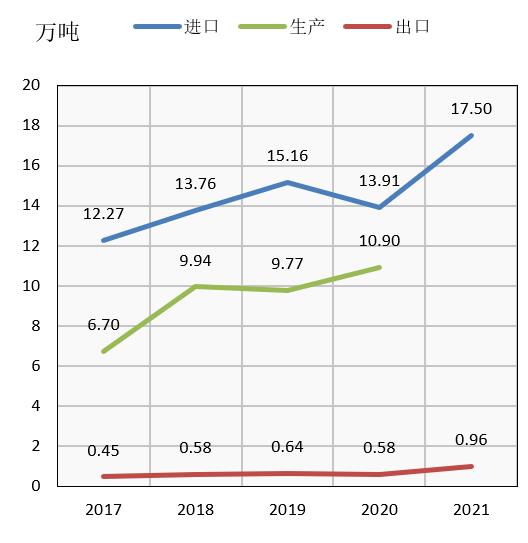
Figure 3 Russia 2017-2021 synthetic fiber production, imports and exports
Note: Production data include tow, import and export data do not include tow.
In January-November 2021, Russian man-made fiber imports were 20400 tons, down 6.4 percent year-on-year. Man-made fibers are mainly imported from China, Indonesia, India and Austria (Table 5). Russian exports of man-made fibers are extremely low, with figures for 2021 of 92 tons. Data on the production of man-made fibers in Russia in 2021 have not yet been released, and the data for 2017-2020 are shown in Figure 4.
Table 5 Russia's imports of manufactured fibers, January-November 2021
|
Country of origin |
Imports (tons)and proportion |
|
China |
0.883 (43.2%) |
|
Indonesia |
0.695 (34.0%) |
|
India |
0.244 (11.9%) |
|
Austria |
0.150 (7.3%) |
|
Thailand |
0.068 (3.3%) |
|
Other |
0.005 (0.25%) |
|
Total |
2.04 (100%) |
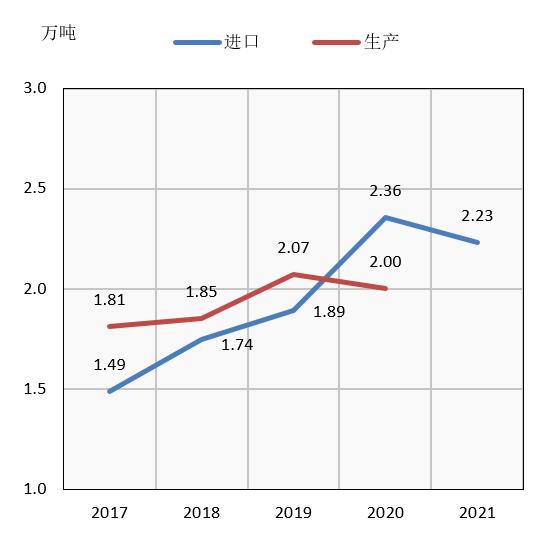
Figure 4 Russia's import volume and production of man-made fibers in 2017-2021
Note: Yield data include tow
About the Author:
Mikhail Brusanov (Mikhail Brusanov), graduated from the Moscow Institute of Textile Technology, proficient in Chinese. Since 2012, he has been engaged in the production of nonwovens. He is currently a technical engineer at Montem Nonwovens Company in Moscow. He is also a part-time editor of the Russian "Polymer Materials" magazine and is responsible for the "Nonwovens" section.
More information

Follow us
Hello, what can we do for you?
Copyright © Xiantao Dexing Plastic Products Co., Ltd / Xiantao Dexing Health Technology Co., Ltd | Powered by:300.cn
SAF Coolest v1.3.1.2 设置面板 FZUSD-ZSNG-OSSQE-ZWE
无数据提示
Sorry, the current column is being updated, please look forward to it!
You can view other columns or returnHome Page